gamma surface with gnuplot
tags: research, gnuplot 材料の機械的性質を議論する場合,generalized stacking fault もしくは gamma surface を考える場合が多い. その場合,ある面内で上下の原子をシフトした場合のエネルギーがどう変化するかを調べるわけだが,その可視化として二次元カラーで表示することが多いようだ. これは,gnuplotで以下のようにして可視化できる.
Data format
x座標,y座標,データの3列のデータを以下のように並べる. :
0.000   0.000 -9.96910530855912E+001
0.000   0.033 -9.89868134250834E+001
0.000   0.067 -9.74010559556275E+001
...
0.000   0.967 -9.88510003534038E+001
0.000   1.000 -9.96910530855912E+001

0.200   0.000 -9.32691179812626E+001
0.200   0.033 -9.14654801350688E+001
のように xデータの値が変わるところで空行が必要. これが結構厄介. ココ などでawk空行を挿入するスクリプトなどが公開されているが, そもそもxデータが毎行変化するようなデータの場合は毎行に空行を入れる必要がある(これ自体は簡単だが,そもそもそれが必要な意味が...)
pm3d
reset
unset key
set pm3d map
set pm3d interpolate 10,10
set xrange [0:1]
set yrange [0:1]
set cbrange [0:10]
set format x ""
set format y ""
set palette rgbformulae 33,13,10
splot fname us 1:2:($3-(e0)) with pm3d
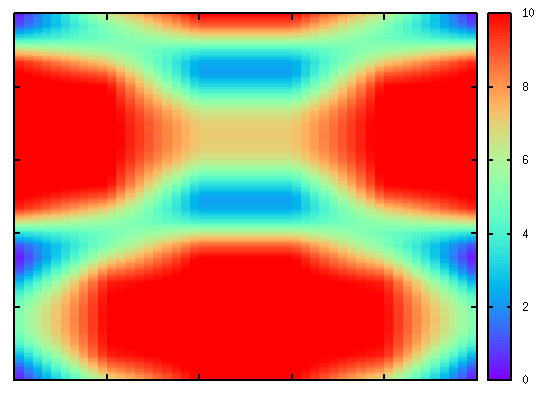
こうすると,以下のようなカラーマップで出力できる.
 {.align-right
width=“500px”}
ここで, :
set pm3d map
とし, :
set pm3d interpolate 10,10
のようにすることで,少ないデータ点の間を補間してなめらかなカラーマップとできる. :
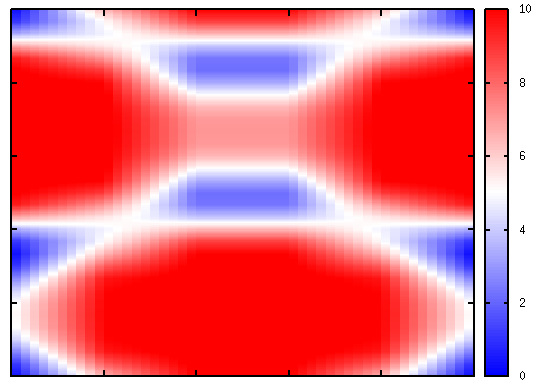
set palette rgbformulae 33,13,10
のところは, :
set palette defined (0 "blue", 5 "white", 10 "red")
のような指定の仕方もあるらしい.この場合以下のようになる
 {.align-right
width=“500px”}
等高線も付ける
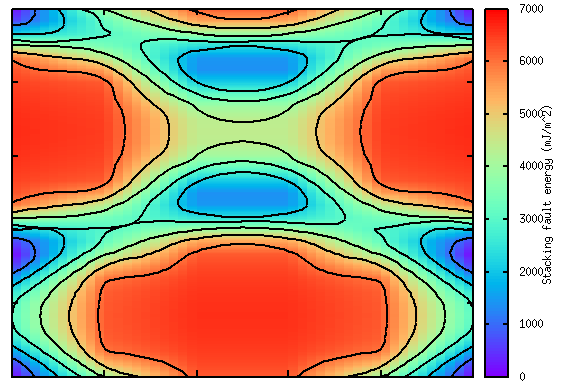
等高線も付ける場合は以下のようにする. 以下の例では,全ての等高線を黒線としている.このようにline styleを指定しないと各等高線は別々の色となる. :
reset
unset key
set pm3d map
set pm3d interpolate 10,10
set contour
set cntrparam cubicspline
set cntrparam levels 10
set style line 1 lw 1.0 lc rgb "#000000"
set style line 2 lw 1.0 lc rgb "#000000"
set style line 3 lw 1.0 lc rgb "#000000"
set style line 4 lw 1.0 lc rgb "#000000"
set style line 5 lw 1.0 lc rgb "#000000"
set style line 6 lw 1.0 lc rgb "#000000"
set style line 7 lw 1.0 lc rgb "#000000"
set style line 8 lw 1.0 lc rgb "#000000"
set style line 9 lw 1.0 lc rgb "#000000"
set style line 10 lw 1.0 lc rgb "#000000"
set style line 11 lw 1.0 lc rgb "#000000"
set style line 12 lw 1.0 lc rgb "#000000"
set style line 13 lw 1.0 lc rgb "#000000"
set style line 14 lw 1.0 lc rgb "#000000"
set style increment user
set xrange [0:1]
set yrange [0:1]
set format x ""
set format y ""
set cblabel "Stacking fault energy (mJ/m^2)"
set palette rgbformulae 33,13,10
splot fname us 1:2:($3-(e0))/area*gpa with pm3d, \
    fname us 1:2:($3-(e0))/area*gpa w l lt -1 lw 1.0 nosurface
結果は以下のような感じ.
 {.align-right
width=“500px”}
set cblabel "..." でカラー・マップのラベルを指定している.